|
3D geospatial modeling and visualization of a
salt diapir based on well control and 3D salt proximity survey data: an example
from Côte Blanche Island field, southern Louisiana, USA Radim A. Kolarsky, Texaco Exploration and Production Inc.
This paper discusses the role of 3D geospatial modeling, salt proximity surveys (SPS) and reservoir characterization in the development of oil and gas pays on the flanks of a salt diapir. This paper describes the building of a rigorous and detailed 3D subsurface depth model of the diapir and the surrounding sedimentary rocks, unconformities and fault planes. The aim of the modeling is to better understand the subsurface geologic structures. Modeling of the salt based on 3D-processed SPS data and well control Great care was taken to determine the interval velocities of the salt overburden, the salt forming the diapir and the sedimentary rocks flanking the salt. Because of that, the results of the surveys represent a very precise position of the salt-sediment interface. The results of 10 recently acquired refractionSPS were combined with well control from approximately 70 wells that penetrated salt. To build the model, this study used a non-proprietary geospatial modeling software package running on a Silicon Graphics workstation. The X,Y,Z coordinates of the SPS salt exit points and the X,Y,Z coordinates of the well control were input into the system and gridded. One of the advantages of this package is its ability to grid surfaces and volumes having multiple Z-values for a given X,Y geographic location, thus making it ideally suited for modeling overhanging salt faces. Modeling of the reservoirs flanking the salt is based on 3D surface seismic and well control. Depth-converted horizons interpreted on a 3D seismic survey were imported into the modeling package and gridded together with well control. The structural model of the salt was then combined with the structural model of the reservoirs flanking the salt. The resulting model gives a comprehensive and visually intuitive picture of the subsurface structures.
In the 1990s, Texaco Exploration and Production Inc. (TEPI) has focused much of its attention on finding and developing new oil and gas reserves hidden beneath overhangs of diapiric salt. This effort has yielded a wealth of new data on salt diapirs. It has also brought about a refined approach to modeling and characterizing reservoirs adjacent to salt diapirs. Some of the approaches and methods described in this paper are being applied by others throughout the "salt dome province" of southern Louisiana.
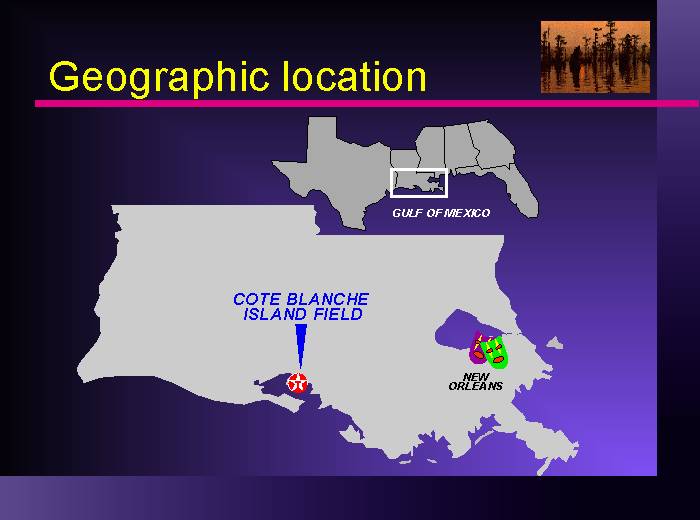
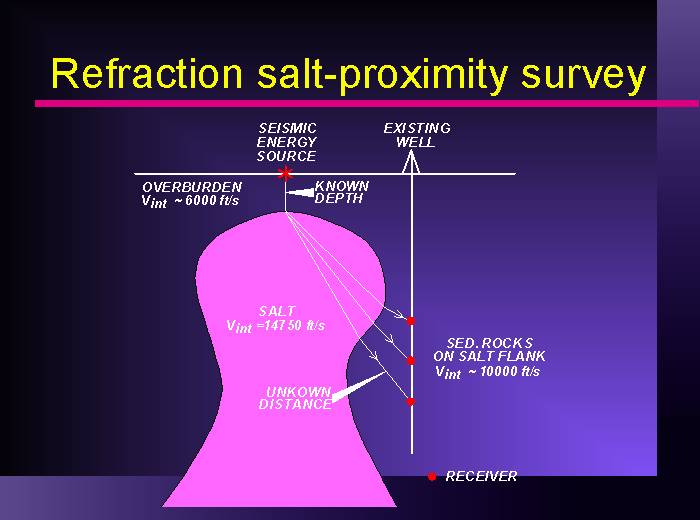
This paper is part of an ongoing study that builds on the work of Hart (1994) who reported on initial success in utilizing state-of-the-art refraction salt proximity survey data in finding significant new reserves under a salt overhand at Vermilion Bay field. This paper is a case history of recent efforts to redevelop Côte Blanche Island, a 50-year-old field in south Louisiana (Fig. 1). Method During the last 5 years we acquired 10 state-of-the-art 3D refraction salt proximity surveys around the diapir in the center of Côte Blanche Island field. Modern acquisition technology allows 3D salt images to be recorded both in old wellbores (using slim-hole tools deployed in tubing) as well as in new wellbores (open or cased). The general principle of refraction salt proximity profiling is summarized in Figure 2.
All seismic sources used
in this study were air gun arrays. Their configuration varied depending
on the contractor performing the work. However, the source was always positioned
in the same location for all surveys. At the source location a shallow expendable
well was drilled to the top of salt to determine the interval velocities
of the overburden as well as the precise top of the salt.
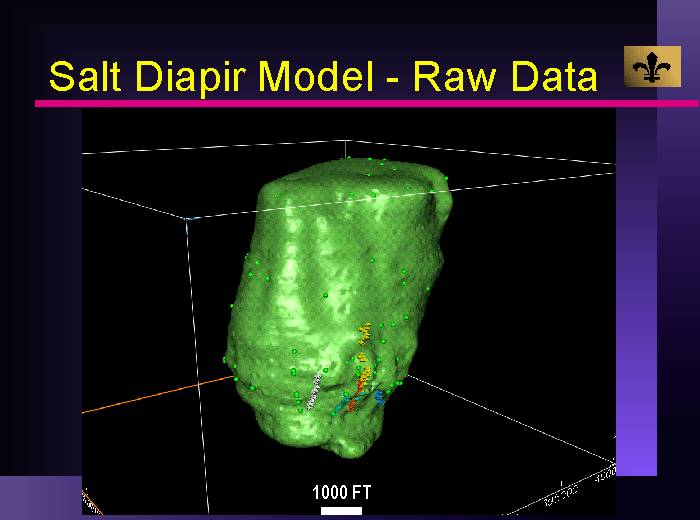
Figure 3. Côte Blanche Island salt diapir model based on well control and salt proximity datapoints. (Click for a large version) The resulting salt exit points of a state-of-the-art salt proximity survey have a three-dimensional quality. To take full advantage of this nature of the data, this study did not use conventional 2D mapping techniques to capture the shape of the salt. Instead, it took advantage of 3D geospatial modeling to integrate the salt proximity with well control. Salt entry and exit points from approximately 70 wells, in addition to the salt proximity datapoints, were input into a 3D geospatial modeling software package. The software can build rigorous structural and stratigraphic models from any datapoints expressed in an X, Y, Z coordinate system (Fig. 3). Its capability to grid and visualize surfaces with multiple Z values (e.g. salt overhangs) makes it ideally suited for this situation. Once the geospatial model of the salt is built, it is integrated with other subsurface geologic data (Fig. 4). Structural interpretations of formation tops and bases, fault planes and unconformities can be brought into the geospatial model and integrated with the salt (Fig. 5). In this study the structural interpretations are based on well control and surface 3D seismic data. The geospatial modeling software rigorously determines intersections of horizons of interest with salt and other reservoir-bounding features (faults etc.).
Conclusions The benefits of 3D geospatial
modeling used in conjunction with 3D salt proximity imaging can be summarized
as follows: Acknowledgments The author wishes to thank following people: Joe Babineaux, Norman Duplantis, Robert Lane and Mark Sunwall of Texaco E&P Inc. for supporting this work and making it possible to present it publicly; Cliff Crowe, Jim Hart and Cathy Enomoto for being great team-mates; Dr. Paul Mann from The University of Texas Institute For Geophysics for his feedback; and, last not least, my wife Lisa who tolerated my staying late to work on this paper after my everyday duties of drilling wells. References Hart, James R., 1994, Rejuvenation of mature fields in south Louisiana through innovative applications of borehole seismic: SEG, 64th Annual International Meeting Expanded Abstracts.
|