Example of quantitative amplitude analysis using updip/downdip ratios.
Using an instantaneous amplitude map from the top of a reservoir,
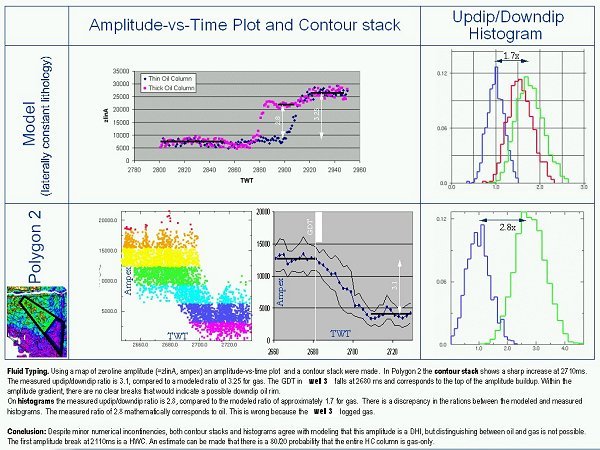
a candidate for a fluid contact is first identified using contour-stacking.
In the second step, two polygons are selected on the map above and below the contact,
amplitude values are extracted within the polygons and plotted as histograms.
The ratio of the P50 amplitudes of the two histograms is noted.
An important pre-requisite is that the seismic data is above tuning
and reasonably close to true-amplitude processing.
Then, a 2D model of a reservoir is built with a fluid contact in the middle.
The model is populated with rock and fluid data obtained from nearby wells,
and several scenarios are set up: oil-water, gas-water, gas-oil.
A synthetic seismic section is created for each model and the amplitude from
the top of the reservoir is extracted. Again, updip and downdip aplitudes are
extracted from the portions of the reservoir above and below the contact,
and presented in the form of a histogram.
An important pre-requisite is that the synthetic seismic section has the
same bandwith, polarity and phase as the field seismic data. It is also important
to set up the near and far offsets of the synthetic seismic as those of the field data,
to simulate as closely any AVO phenomena that are present in the field data.
The updip/downdip ratios are then compared between the field data and the synthetic data.
Whichever modeled ratio most closely resembles the ratio measured on field data
identifes the most likely reservoir fluid.
In this case, the modeled ratios suggested that gas and oil will be indistinguishable
from one another (green and red histograms are largely overlapping), and that
hydrocarbon-bearing formation should be ~1,7x brighter on seismic than wet formation.
Measurements on field seismic data showed an amplitude ratio that was higher (~2.8x)
and a call was made that the reservoir fluid will be either light oil or gas, but that
the amplitude anomaly is representative of hydrocarbons. The discrepancy in the ratios was
was attributed to changes in lithology at the prospect (cleaner sand than what was used
in the model)
or to possible tuning phenomena present in the field data.
The prospect was drilled and the well encountered light oil in a formation that has ~30% porosity
(25% was assumed in the pre-drill modeling).
